
Objective
Explain the value of car-free transportation using an interactive format.
Deliverables
Strategy
For Strong Towns RVA’s Park(ing) Day 2025 installation, we wanted to bring our messaging to life. The concept we were communicating was that non-car transportation saves on parking space. You can read more about it in the “I saved you a spot” project.
To visualize the impacts of non-car transportation, we had the idea of using a tabletop game. The goal was to create a simple, single-person game that a passerby can learn as they played it.
At a minimum, the game needed to simulate the pressure to make tough choices between dedicating enough space for parking and allowing developers to build. The pressure needed to be realistic. If lots of people want to drive, you’ll need a lot of parking.
To balance the game’s definition of success, I defined three stakeholder user groups. The player needed to optimize the best experience for all three groups:
- Drivers: People who drive care that they have a place to park.
- Business owners: Businesses care that they get enough customers. If customers want to drive but can’t park, businesses lose revenue.
- The city: City Hall cares about tax revenue that helps fund better city services for all Richmond citizens. Parking lots generate less taxes than other development.
Before getting into a detailed explanation of the game design process, I invite you to read the instructions if you’re curious about the end result.
Research
To create a realistic game, I needed a foundation of research. The research influenced the game mechanics, but the player didn’t need to know the specific statistics during gameplay. The math was baked into the game design making the game feel fair and true to life.
I researched these three statistics:
- Transportation modal share by city
- Average tax value per acre by land use
- Ideal parking setup and vacancy rates
Transportation modal share
In the default game mode, the ratio of drivers to non-drivers is variable. Drivers require parking. Non-drivers don’t require parking and include people on bikes, pedestrians, transit users and ride share users.
You can’t control how many people will drive or use non-car transportation. The transportation scenario (the ratio of drivers to non-drivers) is predetermined by rolling a single die. Given that a percentage of your citizens like to drive, you need to determine how to best use your land.
For this game mechanic to be realistic, I needed to research realistic ratios of drivers to non-drivers. A ratio of 1 non-driver for every 10 drivers feels realistic, but 10 non-drivers for every 1 driver doesn’t seem right. Are there cities where cyclists, transit users and pedestrians outnumber drivers 10-to-1? I needed to look into it to be sure.
Wikipedia has two tables on their Modal share page that show transportation modal share data from cities around the world. One table is for cities over 1 million population, and one is for cities with more than 250k population. The tables show the percentage split between walking, cycling, public transport and private motor vehicle.
For the purposes of this game, all I needed was the percent of private vehicle transportation. I used that number to calculate the ratio of drivers to non-drivers (everyone besides drivers).
I started by summarizing the data to determine the range of realistic ratios. Richmond has a metro region with a population of 1.2 million, but the population within city limits is less than 250 thousand.
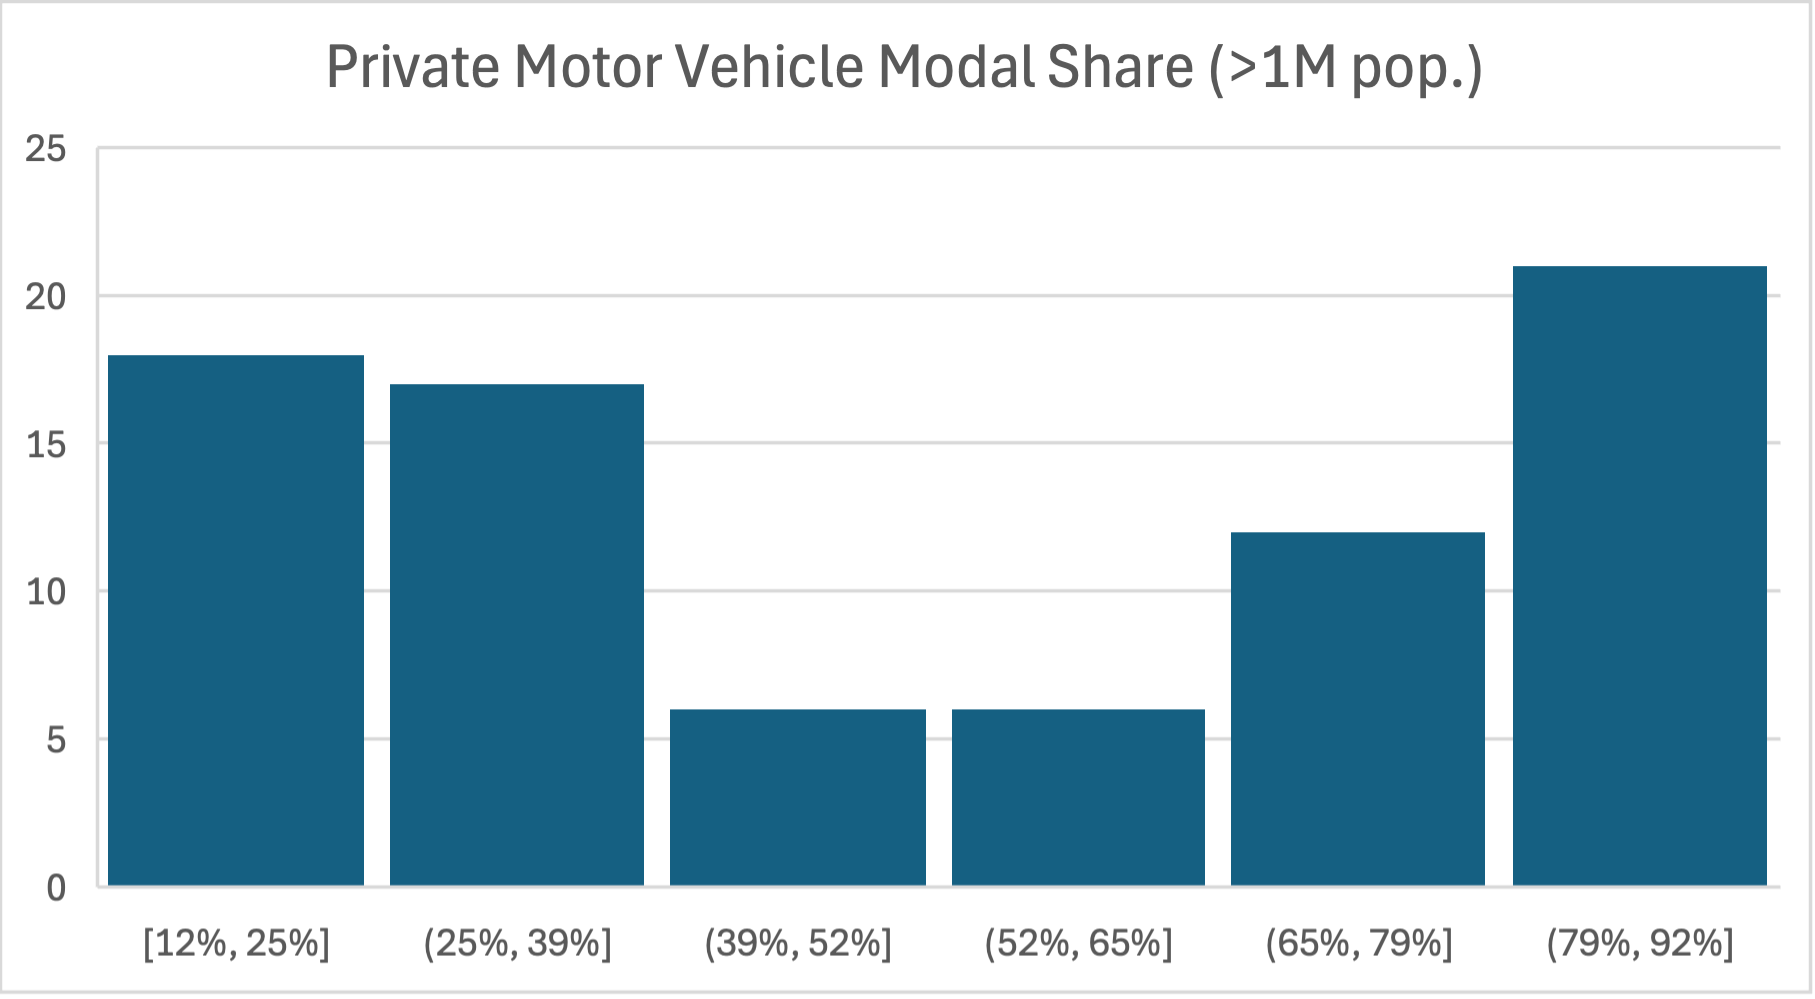
According to Wikipedia, cities with a population over 1 million have an interesting U shape with some on the low end and high end but very few in the middle. This dramatic difference supports the idea that there is a fork in the road for large cities. Some cities commit to being car friendly and some commit to being friendly to everything besides cars.
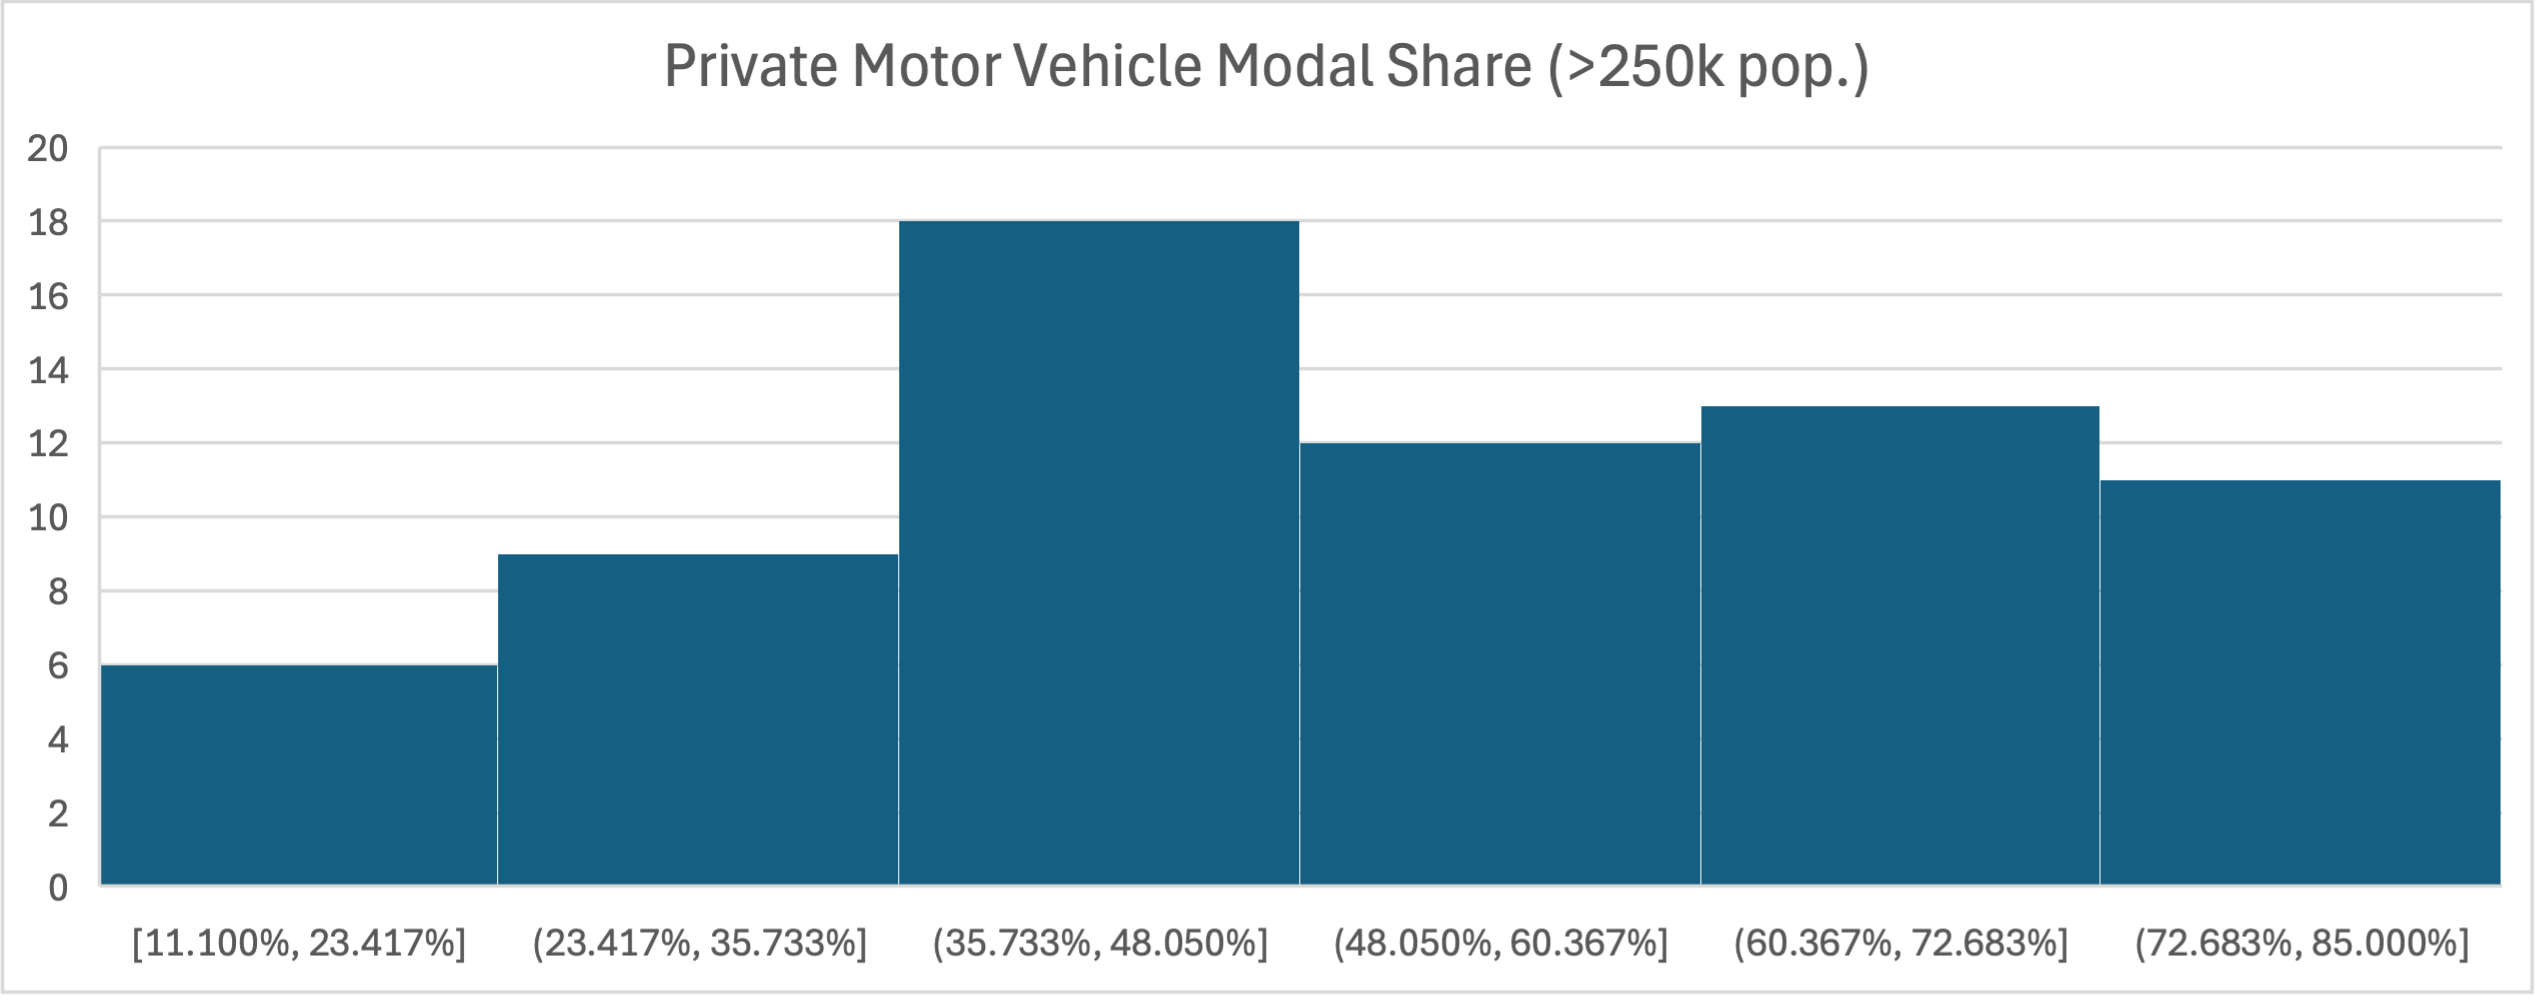
Cities with a population between 250k and 1 million are less extreme. Perhaps they haven’t reached the same fork in the road. Cities in this range tend to be heavier on car use but with a fairly even spread across the whole range.
Based on these two charts, some cities have as much as 92% private vehicle modal share and a little as 12%. This means that most of the ratios I came up with have some equivalent city in the world with that ratio.
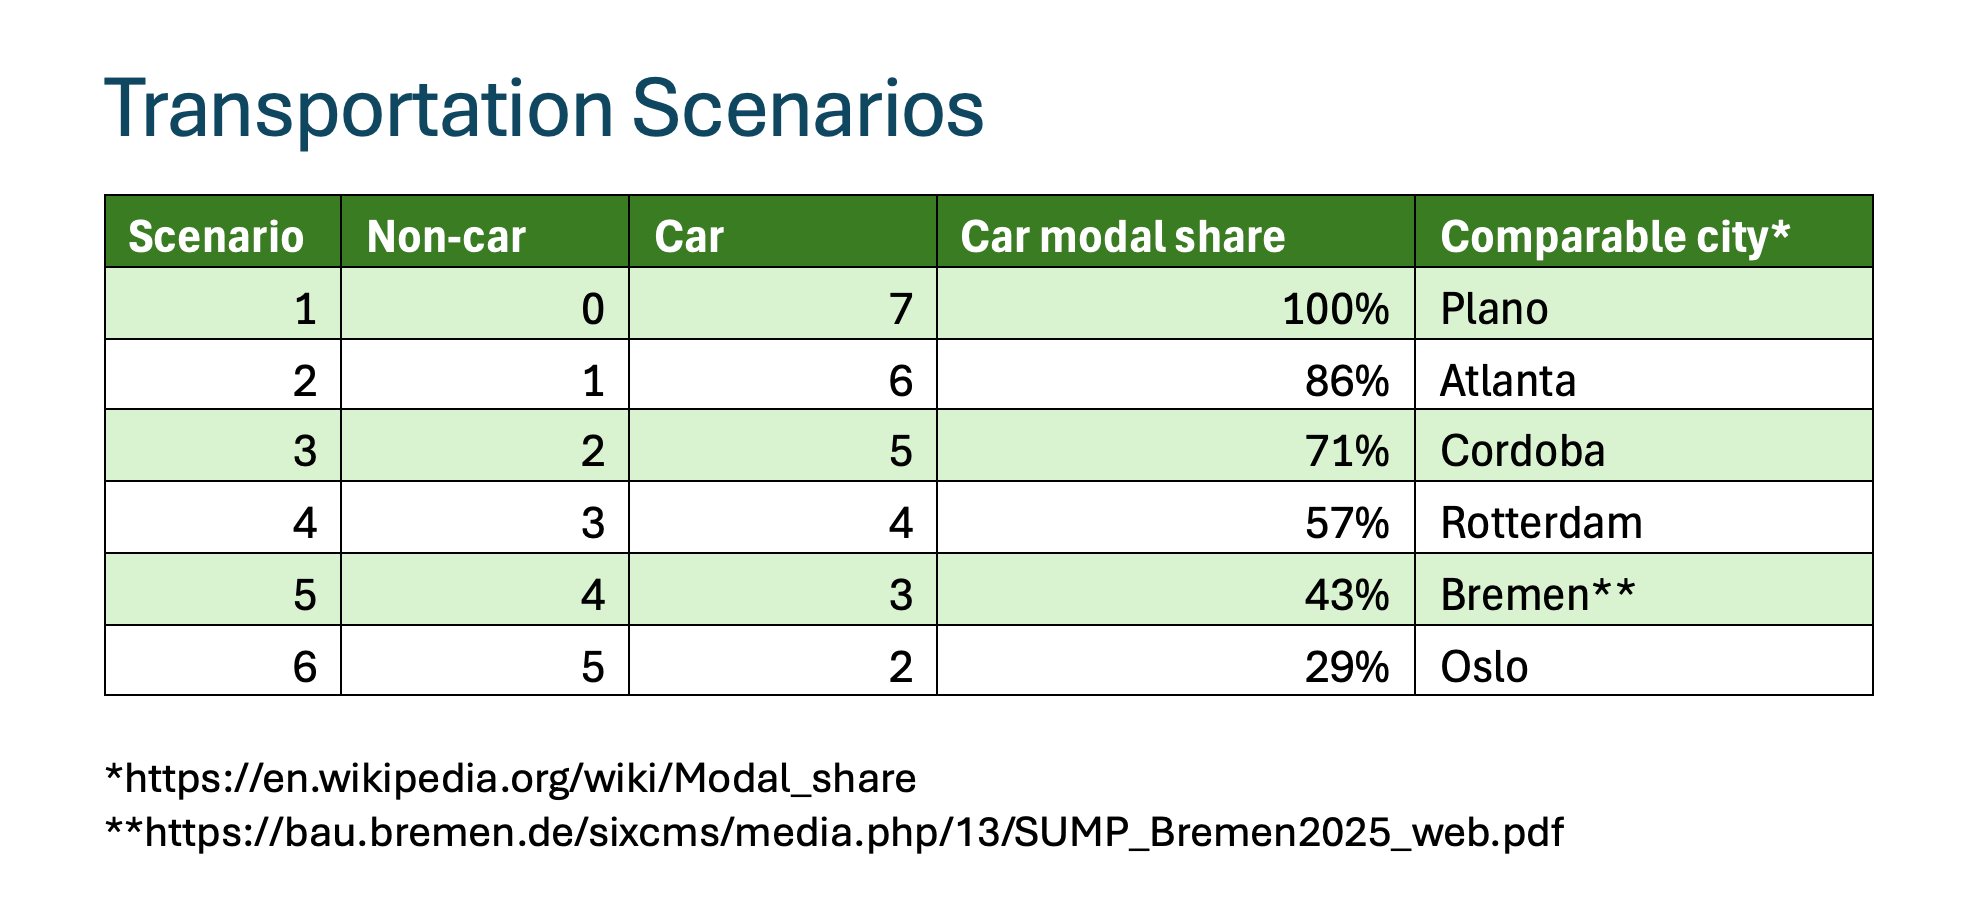
For example, Bremen, Germany lists private motor vehicle usage at 43% on their transportation report. 43% reduces to a ratio of 4 non-cars to 3 cars.
Average tax value per acre by land use
One of the game’s goals is optimizing for tax revenue. Part of the game logic implies that converting parking to a more efficient land use generates more tax revenue.
To make this comparison with real data, I accessed the city’s tax parcel data. This data was a familiar friend. I worked with it before when I completed a value per acre comparison in February (watch the full video on YouTube). I also made a GIS map with color grading for Richmond’s tax value per acre data.
For this parking game, I crunched the numbers again and came up with two numbers. Parcels that were exclusively used for parking generated an average of $4,922 in taxes per acre per year. Parcels used for anything other than parking generated an average of $11,172. This confirms that converting a parking lot to anything else will typically increase tax revenues significantly.
At the scale of this tabletop game, each 0.12-acre parcel adds $750/year in tax revenue when converted from a parking to a building square. If
Ideal parking setup and vacancy rates
For this research, I used Google to find how many parking spaces fit on an acre parcel and what the ideal vacancy rate should be. Fitting parking on a parcel isn’t just a math problem. It depends on how you arrange the parking spaces and driving aisles. Ideal vacancy rate has to do with planning for 10-20% more parking than the number of cars who need parking. A higher vacancy rate reduces the amount of time you need to spend circling a block to find a parking spot.
Game design
Once I completed my research, it validated that I could simplify the game mechanics without losing realism.
I simplified the game’s setup to a grid of 12 equally sized parcels measuring 0.12 acres or about 5227 sq. ft. each or 1.44 acres in total. This roughly matched the city block where we set up our Park(ing) Day installation.
Based on the transportation modal share math, I simplified the population to 7 figurines representing 12 people each. Each of these 7 figurines can either be a car looking for parking or a free to roam, non-car playing piece. 7 figurines representing 12 people meant the block had a total of 84 customers. All this felt realistic for the real-life city block the game was based on.
I then created 6 transportation scenarios and 6 land use scenarios. In the transportation scenarios, the player is given a ratio of drivers to non-drivers that they must accommodate with the correct land use scenario. The land use scenarios have a ratio of parking squares to building squares. Simplifying to 6 of each allowed both elements of game to be determined by a dice roll.
Game balancing
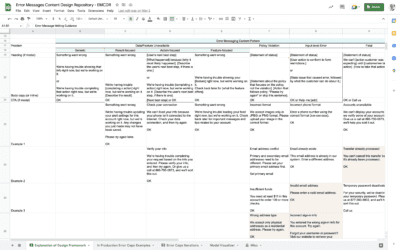
The final piece of the game design was to balance the player choices and starting scenarios. To do this, I created 3 calculation tables.
In the first calculation table, I wrote out the transportation scenarios. I noted how realistic the car modal share ratios were and whether there was an equivalent city.
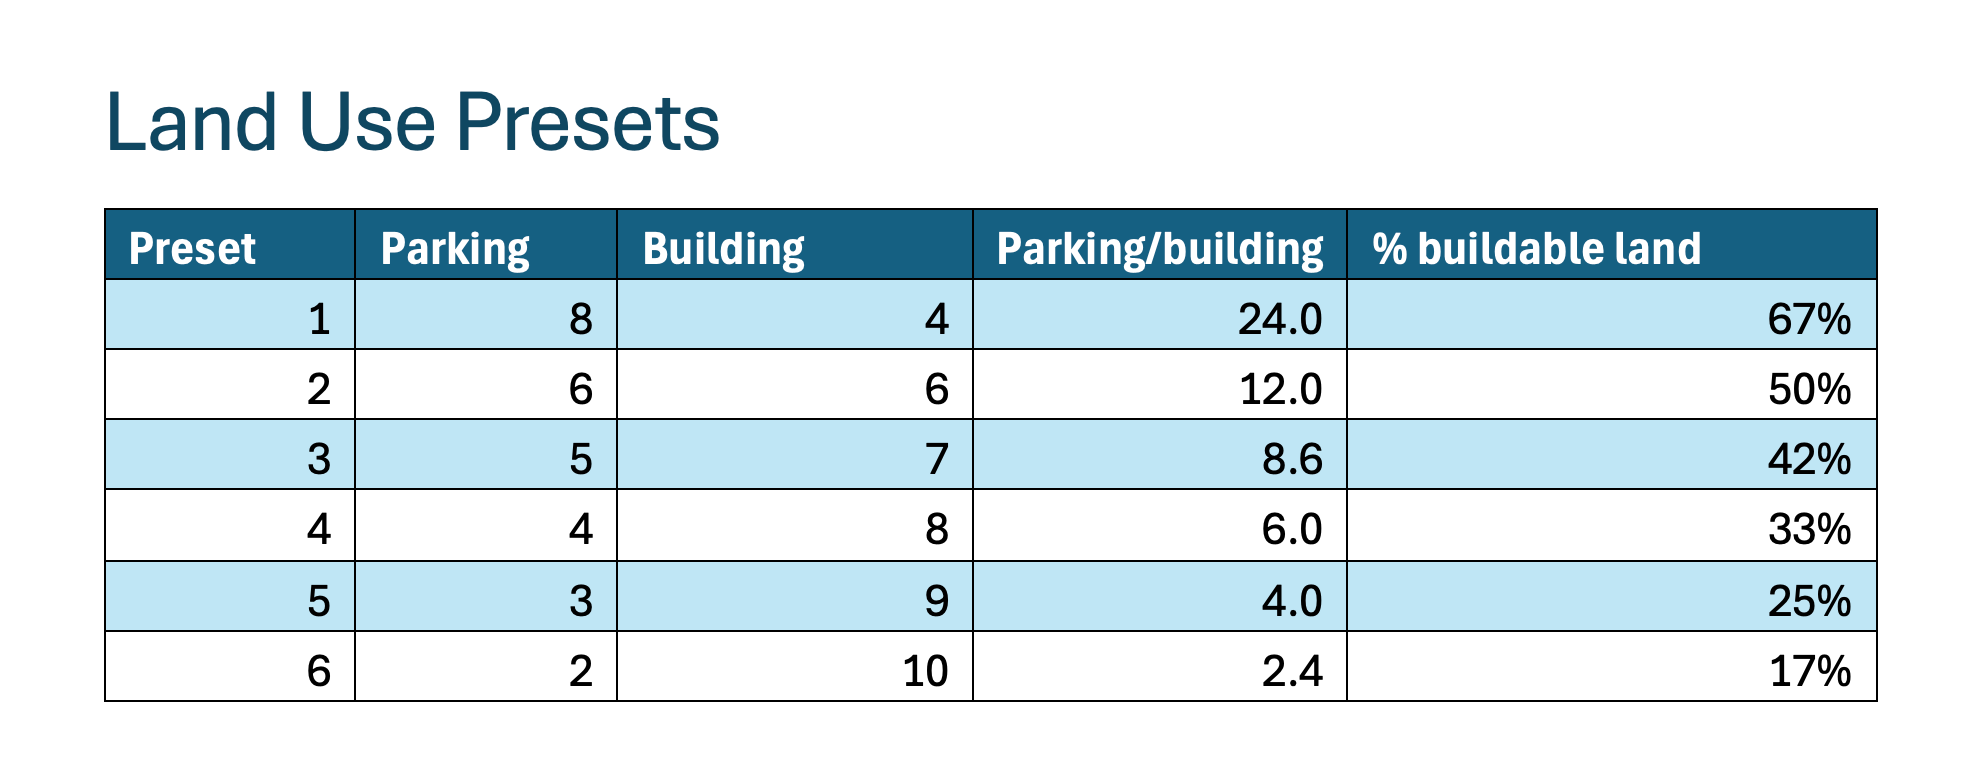
In the second calculation table, I wrote out the land use scenarios. Dedicating 67% of buildable land to parking might seem ridiculous, but it’s surprisingly common. The Shockoe Small Area Plan determined that 54% of the buildable land in Shockoe is surface parking. You can learn more about this topic in a recent Strong Towns RVA YouTube video.
In the third, I applied the game’s scoring system using Excel formulas. The table grabs the land use scenario on the lefthand column and the transportation scenario at the top. It then finds the ratios in the other two tables, applies the scoring system and returns a final score.
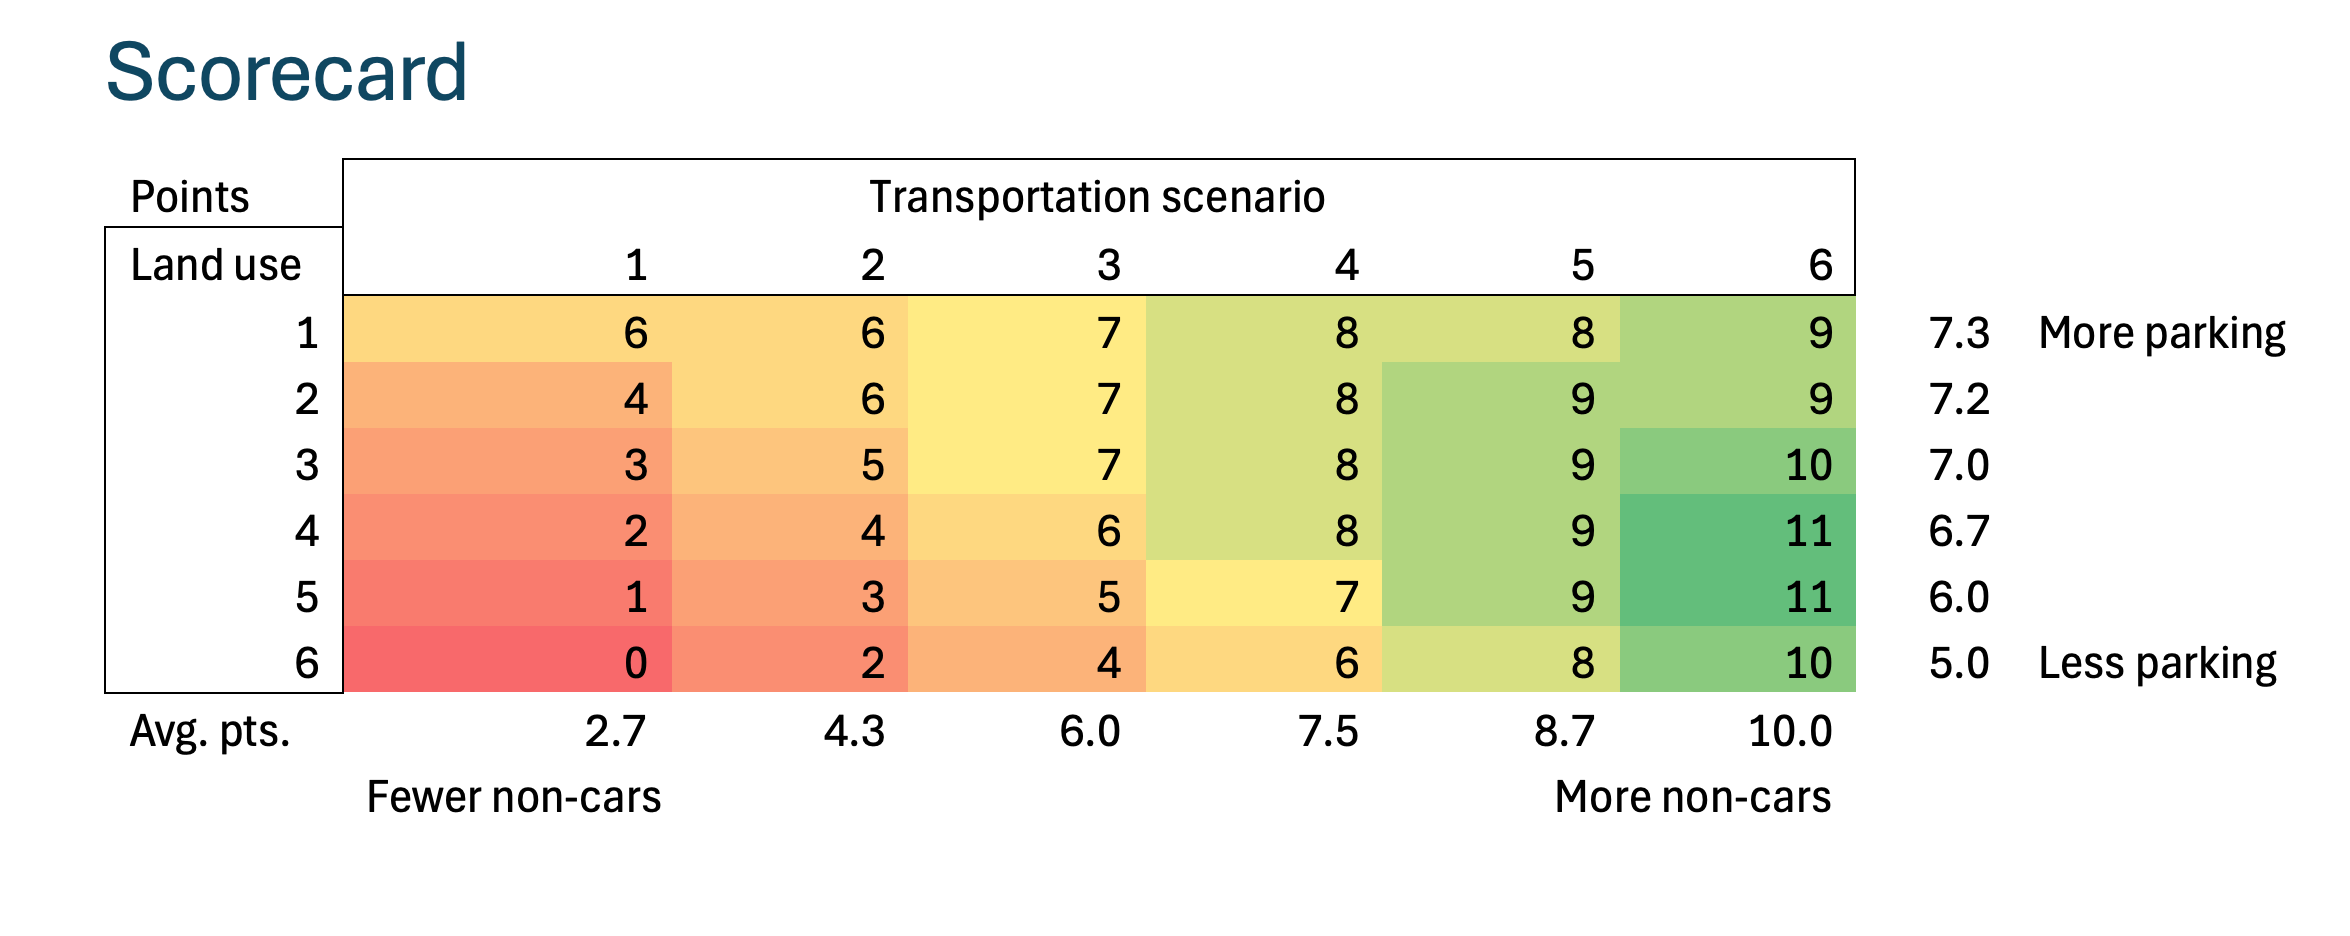
After some tweaking, the scoring system I came up with totaled points based on the 3 user groups.
- Driver points: You get 1 point for each open parking square. You get -1 points for each car that can’t park. All cars parked without vacancy is a score of 0.
- Business owner points: If all figurines (cars and non-cars) can fit on the board, you get 5 points. Subtract 1 point for each figurine that can’t park.
- City points: You get points based on which preset land use choice you select. Preset 1 is worth 0 points, preset 2 is worth 1 point… up to preset 6 worth 5 points.
In the scoring system calculation table, I used conditional formatting to color-code the combinations of total points a player can earn. If look down each column, you can see that each transportation scenario puts a cap on how many points you can earn.
In the first transportation scenario, the most points you can earn is 6 and you lose points for converting parking squares to building squares. But in the 6th transportation scenario, you have a much higher range of achievable points.
This validates the realism of the game. In most of the scenarios where a lot of cars need to park, more parking is better. But if you have fewer cars to park, you have a lot more flexibility to earn more points and save plenty of parking spots for drivers.
The spread of points that the player can earn also confirmed that the game was balanced. If the player is given a scenario, they can make choices that affect their score while still feeling challenged by the scenario.
Instructions
Once the game was designed, I wrote up the instructions. If you’ve read this far in this story, I’ve probably given you the impression the game is complicated by a bunch of math. But none of the math needed to show up in the instructions. All I needed was to explain how to play and let the foundation of realism speak for itself.
One thing to point out here is that I wrote instructions for 4 game modes. In the game modes, the roll of the dice determines one or both aspects of the initial setup and the how the player can proceed.
By alternating what is affecting by randomness and what is the player’s control, the game design lets the player embody different roles. You can play as a city planner where you’re determining how to use land well, but you can’t help it if people want to drive a lot. Or you can play as a transportation advocate where you can’t control how the land was developed but you can influence the public to drive less.
There’s more I can add here about how I structured the instructions, but I’d prefer if you saw it for yourself in this PDF.
Materials
With the game designed and instructions written, I was set to design the squares that made up the game’s grid.
I had the idea of printing off labels and taping them to my son’s Magna-tiles. The tiles were just the right size to hold Hot Wheels cars. Plus, the magnetic click was very satisfying.
For the label design, I used the same “P” from the “I saved you a spot” stickers. These squares were also an exercise in imitating street sign design. This time, the inset black square border with rounded corners was the key feature alluding to a speed limit sign.
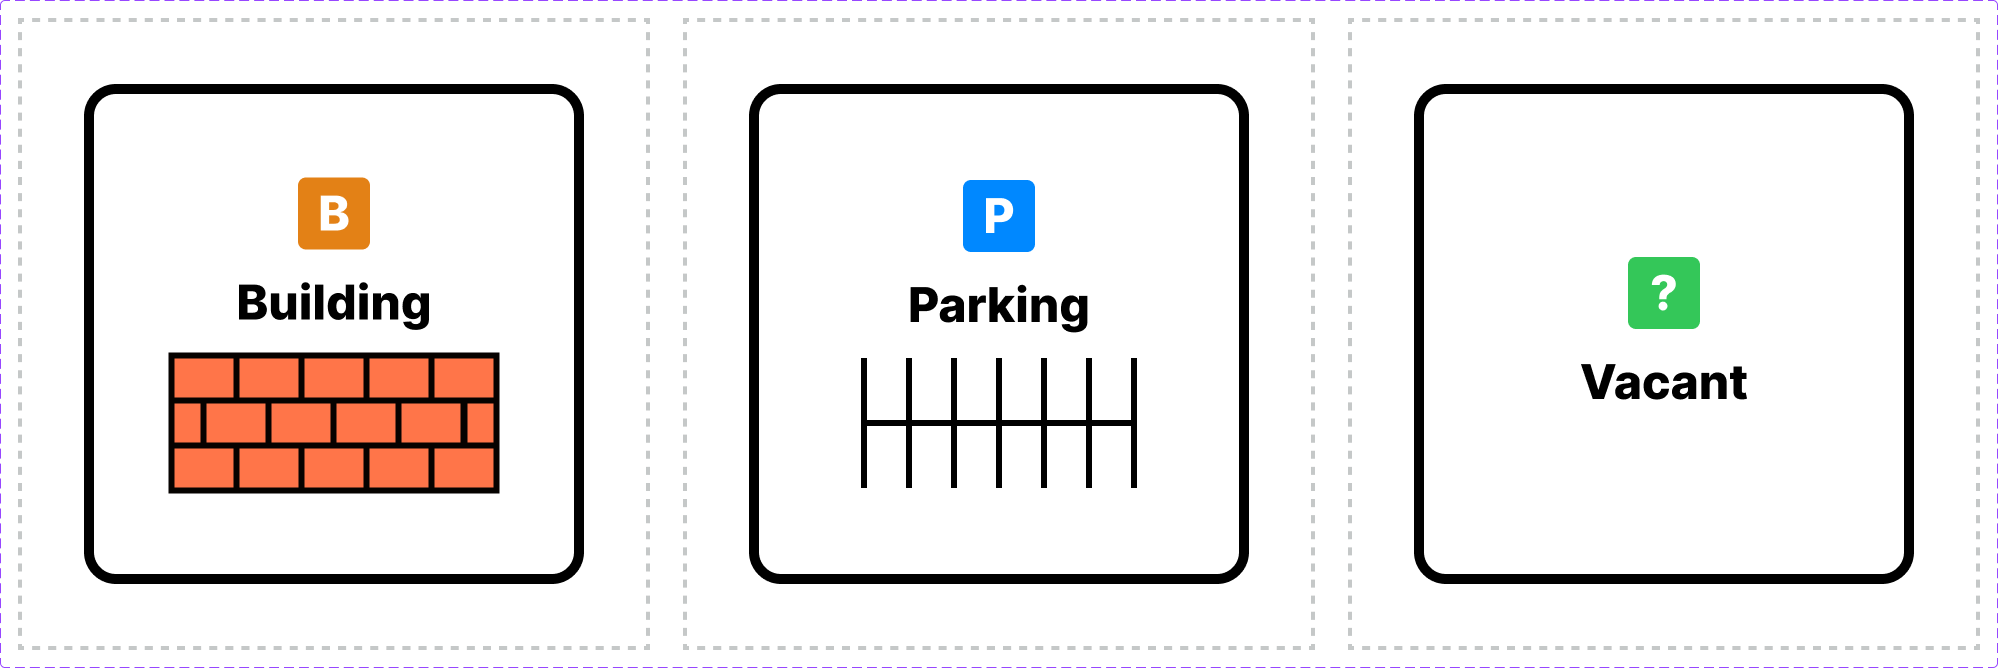
I used Figma’s auto-layout feature to keep spacing consistent. When I was done with one square, I made it into a Figma component and added a variant for each square type. As Figma components, I then arranged a grid of instances in roughly the proportions of printer paper. If I needed to make a change, I made it to the main component and it updated across all instances. I then exported it as a PDF so I knew the file would scale and print correctly in my home printer without clipping. (Thank you, Figma, for being so wonderful!)
If you’d like to play this game for yourself, here are the PDFs for each square type:
Results
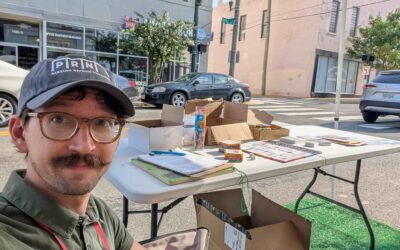
The interactive game helped the Strong Towns RVA team welcome people to the table and learn about parking in Richmond. The game was easy for anyone to complete in only a few minutes. All they did was roll a die once, get their figurines, choose their city block layout and get their score.
While the visitor played the game, I explained the impact of car-free transportation. For each car you didn’t need to park, you had the flexibility in the game to bring in more taxes, keep businesses thriving and build a better city.
Before they walked away, I offered them a sticker with the slogan that the game was putting into action: I saved you a spot. The game successfully celebrated the ways that car-free travelers save a parking spot for everyone, including drivers, local businesses and city planners.
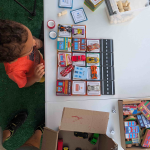
My 3yo plays the Parking Game
-
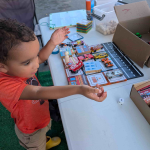
- Step 1: Roll the die and setup your block
-
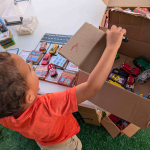
- Step 2: Park your cars
-
- Step 3: Score points